
.png)
The Challenge with Cyclic Service Equipment
Most facilities (refineries, chemical plants, power plants,etc.) have, at most, a handful of assets that truly operate in cyclic serviceas defined in the ASME Codes. These include things like PSAs, mole sieves, and vessels that might have severe thermal transients in operation or during startup/shutdown steps. Because they are not the most common equipment, fatigue is often not well understood or actively managed.
Traditional inspection approaches that are used for most pressure equipment (time-based or risk-based) focus on corrosion and volumetric loss or environmental cracking. Fatigue damage can accumulate quietly until it gets to the point of forming detectible cracks that can be found with flaw detection methods. What can also be challenging is that some vessels in cyclic service (like PSAs) look fine to visual inspections because corrosion is not the most likely damage mechanism.
What Fatigue Really Looks Like
Fatigue is not a sudden failure (typically), but rather agradual process:
- Nucleation: Microscopic cracks form under cyclic stress conditions (often much less than the yield strength of the material).
- Coalescence: Micro-cracks form into small surface cracks that then grow with continued cyclic loading
- Failure: Cracks propagate through the component until failure (brittle fracture, leak, etc.)
The behaviour of welded locations is even more direct because of the potential for crack initiation locations to be inherent in the as-welded condition unless weld improvement activities happened during fabrication (blend grinding, peening, etc.). Locations remote from welds require significant numbers of cycles to initiate cracks before crack growth occurs.
.png)
Why "Design Fatigue Life" may be Misleading
Design fatigue life is not a prediction of failure; it is a Code-based approach that includes margins and factors against failure. In the case of pressure vessel designed to ASME Section VIII, margins are explicitly included:
- Smooth Bar Method (SBM) – factor of 2x stress or 20x cycles below the mean curve of the data
- Structural Stress Method (SSM) – explicitly includes probability in the design curve (typically 3 standard deviations below the mean curve for the failure data).
- Additionally, there are factors to account for environment, weld condition, etc. that further reduce the design fatigue life
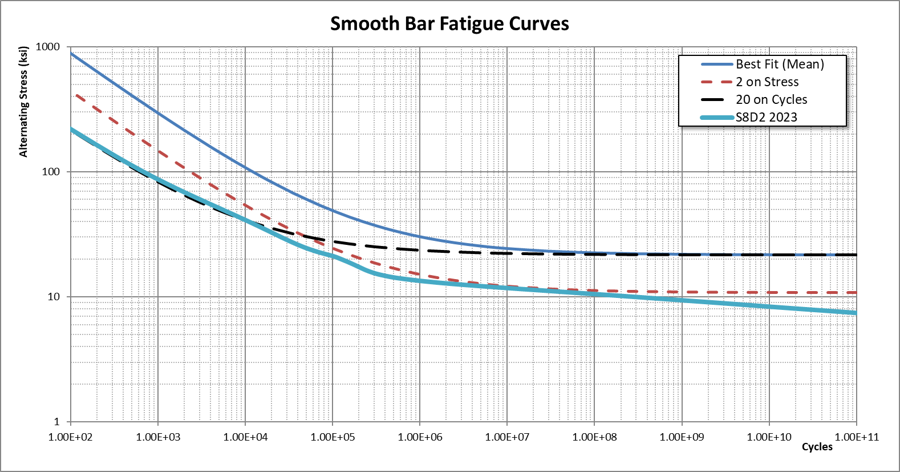
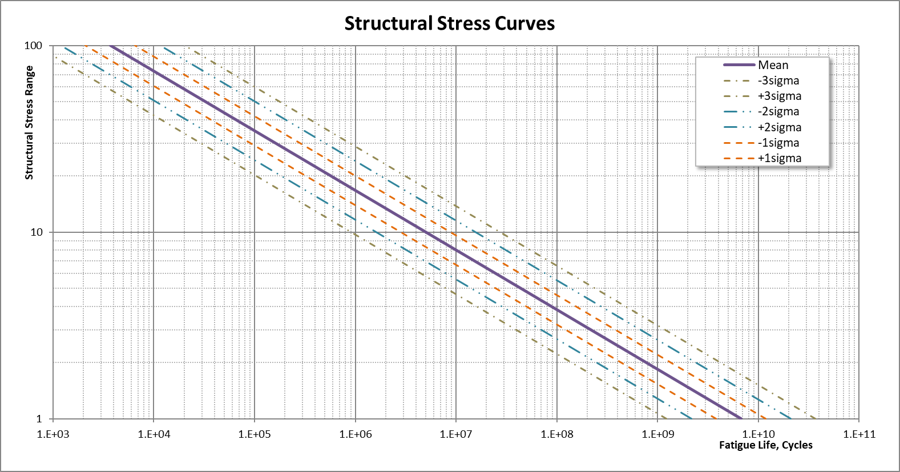
For a vessel that doesn’t have gross fabrication defects where someone finds that the accumulated cycles to date reaches the design life, the most likely outcome is: Nothing happens! Failure is not imminent, but you may have to start managing the asset more carefully.
First Step: Recover Hidden Fatigue Life
.png)
Before replacing equipment or doing something more complex, challenge the original design basis. For equipment that is deemed to be in cyclic service:
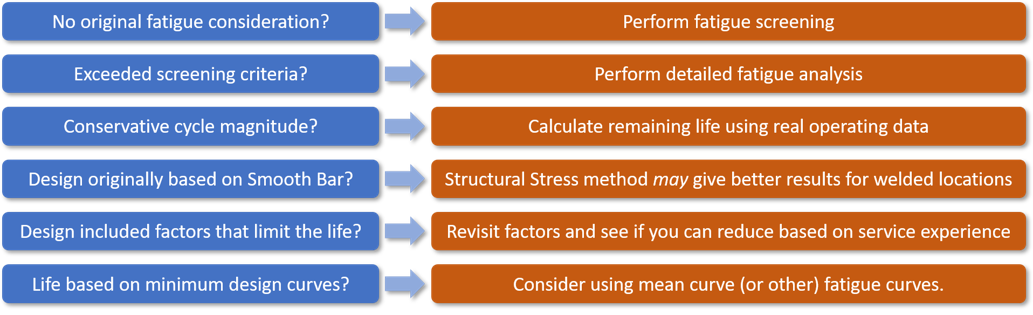
If the above activities result in adequate fatigue life extension, no further action may be needed aside from documenting the analysis (and updating User Design Specifications for Section VIII, Division 2 vessels).
Additional analysis can also aid in ranking of the locations of interest on a piece of equipment by indicating which locations have the most limited fatigue life. One can often determine where cracks would be expected to form first (inside or outside) which can aid in inspection planning.
Second Step: When Fatigue Life Evaluation is Exhausted
Eventually, one may hit a point where:
- Design fatigue life is consumed (even using the above methods to unlock hidden life)
- Further refinement in fatigue evaluation doesn’t help
- Cyclic history and future operation may be uncertain
Ultimately, cyclic operation results in a crack growth problem at some point. We shift from fatigue design considerations to Inspecting for Fatigue.
In this approach, we shift to evaluating how many cycles an actual crack of some initial size takes to grow to a point of failure. This is most often done using a fracture mechanics approach where:
- An initial flaw size is assumed to exist (based on inspection detection limits)
- Predict crack growth per cycle using analytical methods
- Define Failure as fracture risk (API 579 Part 9 FAD), or leak through-thickness
- Calculate how many cycles it takes to grow from the initial flaw to the failure point.
- Inspect the location(s) of interest at a fraction of that cycle life (e.g., 50%)
- This transforms fatigue evaluation from the realm of uncertainty into a predictable, managed process.
Inspection plans are developed to look for detectible cracks. If none are found, assume there are cracks just smaller than the level of detectability and set the next interval. Repeat this process until cracks are detected and then make the decision to repair or replace at that time. At some point the continual inspection and repair cycle costs may be prohibitive and the economics may drive replacement decisions.
Final Thoughts...
Reaching the end of a fatigue design life is often treated as a hard stop. It may just be a point where the management process for these assets needs to pivot.
The challenge is that managing cyclic service equipment requires a different mindset than conventional mechanical integrity programs. It requires understanding:
- what actually constitutes a fatigue cycle (pressure, thermal, mechanical, etc.)
- where fatigue damage is most likely to occur,
- how inspectin methods relate to flaw detectability,
- and when fracture mechanics becomes the more appropriate tool.
Facilities that understand these concepts can often:
- avoid premature replacement,
- focus inspections more effectively,
- reduce unnecessary conservatism,
- and make better long-term run/repair/replace decisions.
This article only scratches the surface of the subject.
If you have equipment operating in cyclic service and you need help understanding your current state, CANATUS offers a short, high level overview class on the subject. We get into fatigue screening and defining cycles in more detail.